Market Turbulence in Focus: A Strategic Analysis of SVXY and Black Swan Events

Important Notice
Our site will soon publish the forecast model predictions based on a 7-day forecast period. Please note that this article is for informational purposes only and does not constitute investment advice.
Introduction
In today’s volatile financial markets, sudden and dramatic events—often termed “Black Swan” events—pose significant challenges to traditional risk management methods. This article provides an in-depth analysis of SVXY, an inverse ETF linked to the VIX, through a predictive model based on XGBoost. Our analysis covers a 7-day forecast period and explores the implications of market volatility, while reiterating that this content is solely for information purposes.
Market Volatility and Black Swan Events
Market volatility, the measure of price fluctuations over a short period, plays a critical role in assessing investor sentiment and risk.
- Black Swan Events: Rare and unpredictable events that can trigger severe market disruptions.
- VIX Index: Known as the "fear gauge," the VIX quantifies market anxiety and is pivotal in understanding volatility dynamics.
Historical examples underscore how these events can cause rapid shifts, challenging even sophisticated predictive models.
Overview and Features of SVXY
SVXY is designed to move inversely with the VIX index, offering investors a unique tool to capitalize on periods of market calm.
- Key Characteristics:
- As an inverse ETF, SVXY gains value when market volatility subsides.
- It is susceptible to significant losses during sudden volatility spikes.
- Trading Flexibility:
- SVXY can be traded through standard brokerage channels, including short-selling and options strategies, enhancing its appeal as a tactical instrument.
7-Day Forecast Analysis Using XGBoost
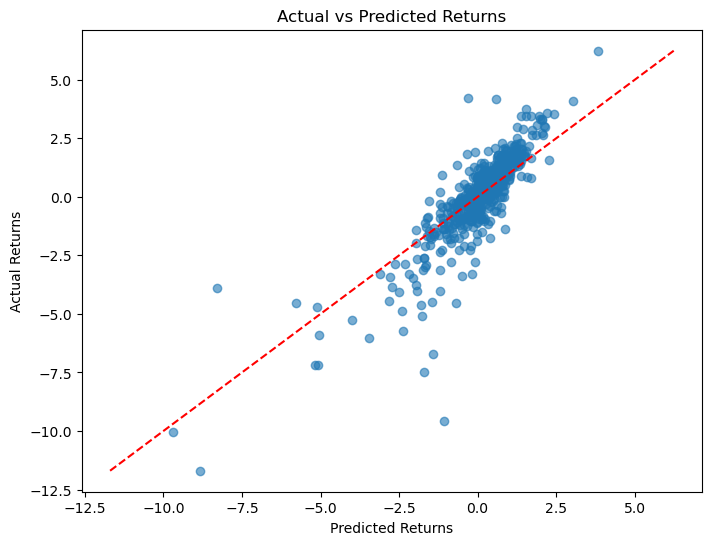
Leveraging the power of the XGBoost model, we have constructed a predictive framework to analyze SVXY’s price movements over a 7-day horizon.
- Model Overview:
- The model integrates various market data points, such as energy prices, interest rate indicators, and equity market indices.
- Our analysis reveals that prediction errors tend to widen during extreme market downturns.

Feature Importance Analysis
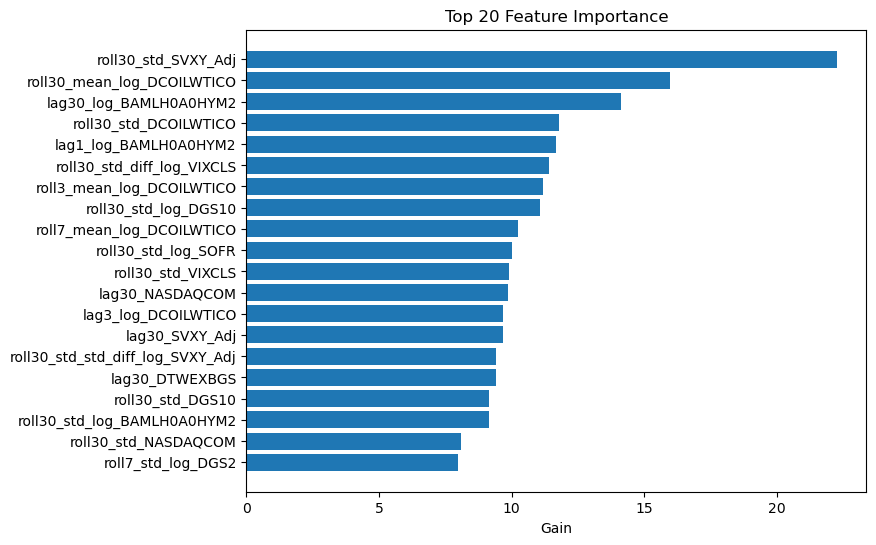
The XGBoost model also provides insights into which factors are most influential in driving SVXY’s performance.
- Key Factors:
- Short-term volatility of SVXY itself, WTI crude oil prices, the VIX index, and various interest rate indicators are among the top contributors.

- Figure 2: Feature Importance Visualization
This figure is provided solely as an illustrative example. While a deep understanding of machine learning is not required, such visualizations can offer an intuitive glimpse into how different features contribute to the model.
Considerations on Shorting SVXY
In theory, shorting SVXY could offer significant gains during Black Swan events, when market panic leads to sharp declines.
- Strategic Rationale:
- Given SVXY’s inverse relationship with market volatility, a short position might capitalize on abrupt market downturns.
- Risk Management:
- However, maintaining such positions involves costs—like high borrow fees—and requires precise timing and rigorous risk controls.
- It is essential to understand that while this strategy might have potential during crises, it also entails significant risk in calmer market conditions.
Summary and Future Outlook
This analysis has explored the dynamics of SVXY amidst turbulent market conditions, using an advanced XGBoost predictive model to forecast price movements over a 7-day period.
- Our findings highlight the complexities of predicting market behavior during Black Swan events.
- The feature importance analysis underscores the significant roles of energy prices, interest rate movements, and the VIX index in influencing SVXY.
- Although a short position in SVXY could theoretically offer an edge during market shocks, comprehensive risk management is imperative.
Final Notice
As a reminder, our site will soon publish the detailed forecast model predictions. We appreciate your interest in our analytical insights and encourage you to stay tuned for the upcoming data release. Thank you for reading.
Disclaimer
This article is intended for informational purposes only and does not constitute investment advice. Please conduct your own research and consider your risk tolerance before making any investment decisions.